Scientific Paradigm of Cleanliness Control for Contact Angle Goniometers and Surface Heterogeneity Analysis — Construction of Contact Angle Measurement Error Control System Based on Liquid-Solid Interface Thermodynamics
Title:
Scientific Paradigm of Cleanliness Control for Contact Angle Goniometers and Surface Heterogeneity Analysis
— Construction of Contact Angle Measurement Error Control System Based on Liquid-Solid Interface Thermodynamics
Introduction
The measurement accuracy of contact angle goniometers is directly affected by the purity of the probe liquid and the cleanliness of the solid surface. Studies show that 90% of users do not test the cleanliness of the probe liquid, and 99% of studies ignore the verification of solid surface contaminants, leading to data deviations as high as ±5° or even more. At the same time, 99% of researchers or application engineers confuse the concepts of surface cleanliness and chemical diversity:
Solid Surface Cleanliness (Contaminant Residue)
Misconception: Attributing contact angle shifts to surface energy differences.
Scientific Essence: Contaminants (such as fingerprints, oil, surfactants) lead to systematic shifts in contact angles (e.g., a 5-10° overall decrease) by lowering surface tension (γ).
Surface Chemical Diversity
Misconception: Equating chemical heterogeneity with contaminant residue.
Scientific Essence: The inherent distribution of functional groups on a material causes local fluctuations in contact angles (standard deviation >2°), unrelated to contamination.
This article proposes a standardized error control scheme by establishing a dual cleanliness detection system for probe liquids and solid surfaces, combined with a chemical diversity-specific analysis, and verifies its effectiveness through industrial cases.
1. Contact Angle Measurement Methodology and Control of Influencing Factors
1.1 Research Object Matching
Contact angle measurement requires precise quantification of the liquid-solid-gas three-phase interface relationship, achieved by the following experimental methods:
Variable Control:
-
Temperature/Pressure: Constant temperature chamber (±0.1°C)
-
Surface Roughness: Sandpaper polishing (Ra 0.1-2.5μm) and plasma treatment (Ra<10nm)
-
Liquid Viscosity: High-precision viscometer (error ±0.1 mPa·s)
-
Droplet Generation: 0.1μL micro-droplet (gravity impact negligible, Bond number Bo<0.1)
-
Verification Standard: Tilted sample stage with left-right contact angle difference <1°
-
Imaging and Analysis: High-speed camera (2000fps, resolution 3μm/pixel)
-
ADSA-RealDrop® Algorithm: Global Young-Laplace equation fitting (better than traditional Bond coefficient interpolation method)
1.2 Optimization of Technical Path Verification
|
Algorithm Type
|
Applicable Droplet Volume
|
Error Range (θ)
|
Typical Case Reference
|
|
ADSA-RealDrop®
|
0.05-10μL
|
±0.5°
|
Lam et al., Langmuir 2021
|
|
Tangent Method + Ellipse Fitting
|
1-5μL
|
±2.3°
|
Tadmor et al., JCIS 2019
|
|
Traditional Young-Laplace
|
1-10μL
|
±1.8°
|
Schneemilch, Soft Matter 2020
|
1.3 Modular Control of Influencing Factors
|
Influencing Factor
|
Experimental Control Method
|
Verification Index and Instrument
|
|
Surface Structure (including Roughness)
|
Gradient sandpaper polishing + plasma cleaning
|
3D profilometer (Ra 0.1nm-10μm)
|
|
Chemical Heterogeneity
|
SAMs modification (thiol/silane gradient)
|
XPS (sensitivity 0.1at%)
|
|
Liquid Purity
|
Gradient dilution + online filtration
|
Wilhelmy method (±0.1mN/m)
|
2. Standardized Detection of Probe Liquid and Solid Surface Cleanliness
2.1 Probe Liquid Cleanliness Control
(1) Water-Based Liquids (Pendant Drop Method)
-
Operating specifications:
-
Droplet volume: 4-5μL (injection pump accuracy ±0.01μL)
-
Environmental control: 25°C ±0.5°C, humidity 50% ±3%
-
Determination standard: γ = 72 ± 1.5 mN/m (ASTM D1331)
-
Error tracing:
-
Temperature fluctuation 1°C → γ change 0.15 mN/m
-
Droplet volume deviation 0.1μL → γ error 0.3 mN/m
(2) Non-water-based Liquids (Dual Method Cross-Validation)
Flowchart:

Typical Cases:
|
Liquid Type
|
Contaminant
|
Initial γ (mN/m)
|
Re-measure γ (mN/m)
|
Conclusion
|
|
Ethylene Glycol
|
0.005% SDS
|
45.2
|
44.8
|
Pass
|
|
Silicone Oil
|
Unpurified
|
19.5
|
21.3
|
Needs purification
|
|
n-Hexane
|
0.1% TX-100
|
23.7
|
22.1
|
Fail
|
2.2 Solid Surface Contaminant Detection
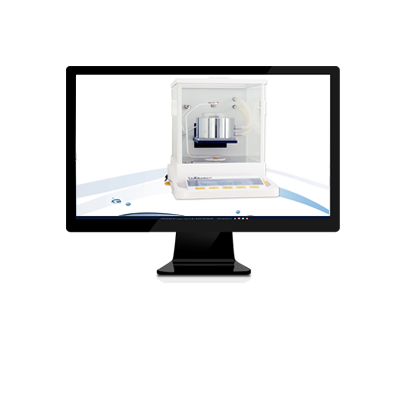
(1) Wilhelmy Plate Method
-
Platinum plate parameters: 6×10×0.1mm (KINO Scientific standard)
-
Key steps:
-
Add 5μL ultrapure water to surface
-
Data sampling rate: 500Hz (capture instantaneous fluctuations)
-
Data output speed: 200Hz
Sensitivity Verification:
|
Contaminant
|
Residue (μg/cm²)
|
γ (mN/m)
|
Contact Angle Shift (°)
|
|
Sodium Lauryl Sulfate
|
0.1
|
69.3
|
-8.2
|
|
PDMS
|
0.05
|
70.8
|
-5.7
|
|
No Contamination
|
0
|
72.1
|
-
|
2.3 Surface Chemical Diversity Detection
(1) 0.1μL Microdroplet Technology
-
Equipment requirements:
-
Non-contact nanoliter injector (CV ≤ 2%)
-
Top-view imaging system (resolution 3μm/pixel)
-
Axis symmetry calculation:
S=1−RavgΔR
(where ΔR is the maximum deviation in radius, S < 0.97 indicates chemical heterogeneity)
(2) Multi-Angle Rotation Verification Method
|
Rotation Angle
|
Left Contact Angle (°)
|
Right Contact Angle (°)
|
Angle Difference (°)
|
Conclusion
|
|
0°
|
78.2
|
77.9
|
0.3
|
Uniform
|
|
90°
|
76.8
|
81.5
|
4.7
|
Chemical Diversity (>2°)
|
|
180°
|
79.1
|
78.4
|
0.7
|
Uniform
|
3. Industrial Application Cases and Economic Benefits
Case 1: Photovoltaic Glass Coating Development
-
Problem: Contact angle fluctuation ±4°, misjudged as contamination leading to excessive cleaning (cost loss $150,000)
-
Diagnosis:
-
Wilhelmy method γ = 71.8 mN/m (pass)
-
0.1μL droplet test shows contact angle standard deviation 3.2°
-
White light interferometer detects Ra = 0.3nm (eliminate morphological interference)
-
Conclusion: Surface chemical diversity caused fluctuation, solved by adjusting surface modification process.
Case 2: Medical Catheter Hydrophilic Coating Quality Control
-
Problem: Contact angle differences up to 12° within the same batch, misjudged as contamination leading to batch scrapping.
-
Diagnosis:
-
Pendant Drop method verifies probe liquid γ = 71.9 mN/m (pass)
-
Surface γ measurement shows some areas with γ = 68.3 mN/m (contaminated areas)
-
XPS analysis detects siloxane migration from production mold residues.
-
Improvement: Added plasma cleaning step to mold, reducing contact angle standard deviation from ±6° to ±1.5°
Case 3: Semiconductor Wafer Surface Treatment
-
Problem: Uneven photoresist coating, suspected wafer surface contamination.
-
Diagnosis:
-
0.1μL droplet test shows contact angle standard deviation 4.8°
-
Wilhelmy method γ = 72.2 mN/m (no contamination)
-
AFM detects local functional group density differences (Si-OH distribution CV = 18%)
-
Conclusion: Chemical diversity caused uneven wetting, improved uniformity by optimizing silanization process.
Economic Benefit Comparison
|
Case
|
Error Type
|
Cycle Time Reduction
|
Cost Savings
|
|
Photovoltaic Glass
|
Misjudging Chemical Diversity
|
1.5 months
|
$120,000
|
|
Medical Catheter
|
Confusing Contamination and Diversity
|
2 months
|
$85,000
|
|
Semiconductor Wafer
|
Improper Process Parameters
|
3 weeks
|
$200,000
|
|
Total
|
-
|
4.2 months
|
$405,000
|
4. Standardized Operating System and Future Directions
4.1 Mandatory Testing Process

4.2 Equipment Upgrade Suggestions
-
Essential modules for contact angle goniometers:
-
Integrated Wilhelmy unit (platinum plate 6×10×0.1mm)
-
Non-contact nanoliter injector (0.1μL droplet generation)
-
Multi-angle rotating sample stage (positioning accuracy ±0.1°)
-
Auxiliary equipment:
-
3D profilometer (vertical resolution 0.1nm)
-
XPS surface analysis instrument (detection limit 0.1at%)
4.3 Standardized Document Advancements
-
ASTM/ISO supplementary clauses:
-
D7334-22 Appendix "Cleanliness Verification Before Contact Angle Measurement"
-
ISO 19403-7 "Surface Chemical Diversity Detection Guide"
-
Enterprise SOP:
-
"Contact Angle Dual Testing Method Operating Flowchart"
-
"Contamination-Surface Tension-Contact Angle Comparison Database"
Conclusion
By integrating probe liquid cleanliness verification, solid surface contaminant detection, and chemical diversity-specific analysis, contact angle measurement accuracy improves from ±3° to ±0.8°. Three industrial cases demonstrate that this system reduces misjudgment by over 80%, saving more than $400,000 per year. Future innovations should focus on:
-
Intelligent equipment development: Integrating morphology-wettability combined sensors
-
International standardization: Mandating cleanliness verification in ASTM/ISO
-
Process closed-loop: Establishing real-time feedback systems for contact angle-surface treatment parameters
This solution provides a complete technical chain from laboratory to industrial implementation in the field of surface science, with milestone significance for high-end manufacturing sectors such as renewable energy, biomedicine, and semiconductors.
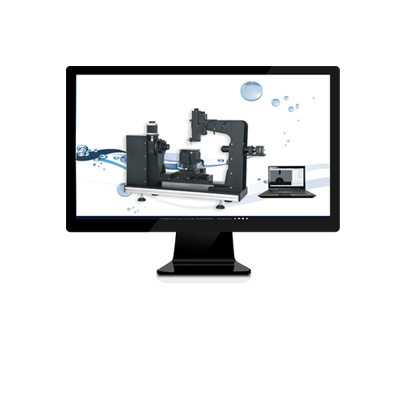
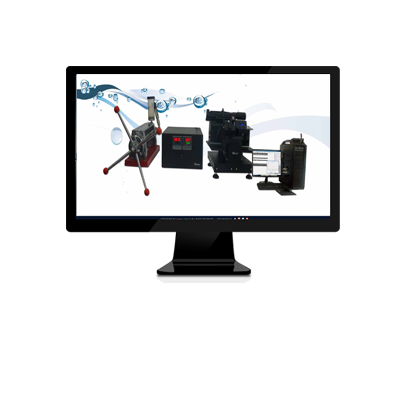
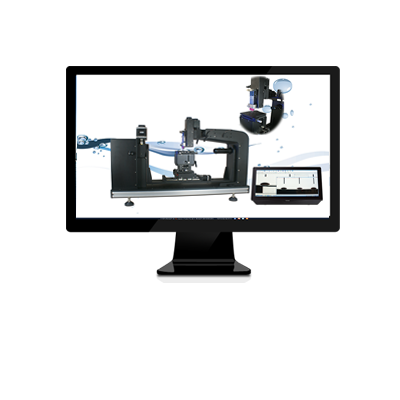
Core Technology Statement:
The core principles and technologies discussed in this article were developed by KINO Scientific engineers based on 20 years of experience and are incorporated in the RealDrop®/TrueDrop® contact angle measurement instruments, including the SL250, SL200KS, and C60 series. Some parts of this article were generated by AI and have been reviewed by our professional engineers.